Delimit calibration area for constructing species distribution models
Source:R/calib_area.R
calib_area.RdThis function offers different methods to define the calibration area. The output could be used with other flexsdm functions like sample_backgroud, sample_pseudoabs, and sdm_predict, among others
Arguments
- data
data.frame or tibble. Database with presences
- x
character. Column name with longitude data
- y
character. Column name with latitude data
- method
character. Method used for delimiting a calibration area. Could be necessary to concatenate (c()) different objects for this argument. The following methods are implemented:
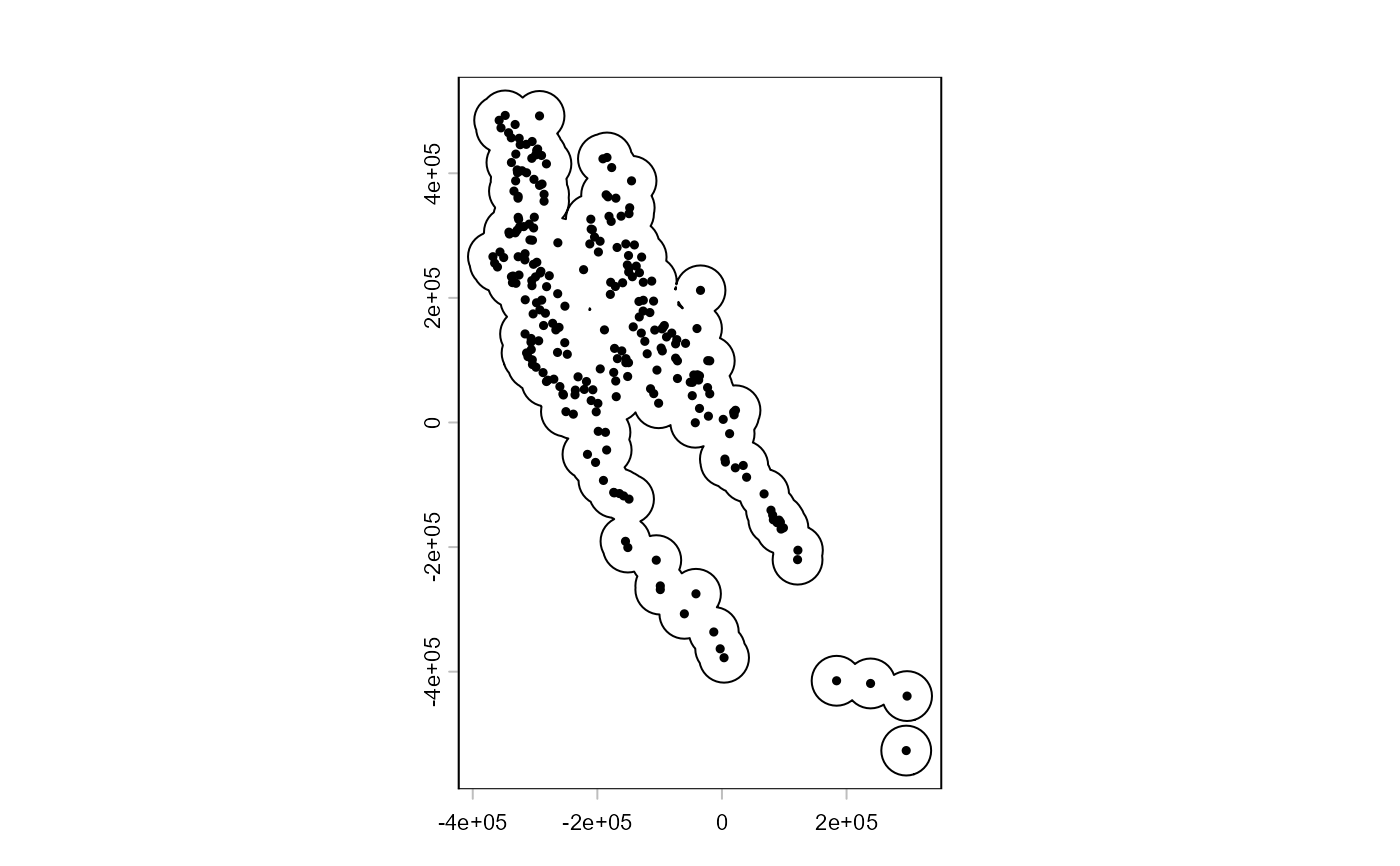
buffer: calibration area is defined by a buffer around presences. Usage method = c('buffer', width=40000). A value of the buffer width in m must be provided if CRS has a longitude/latitude, or in map units in other cases
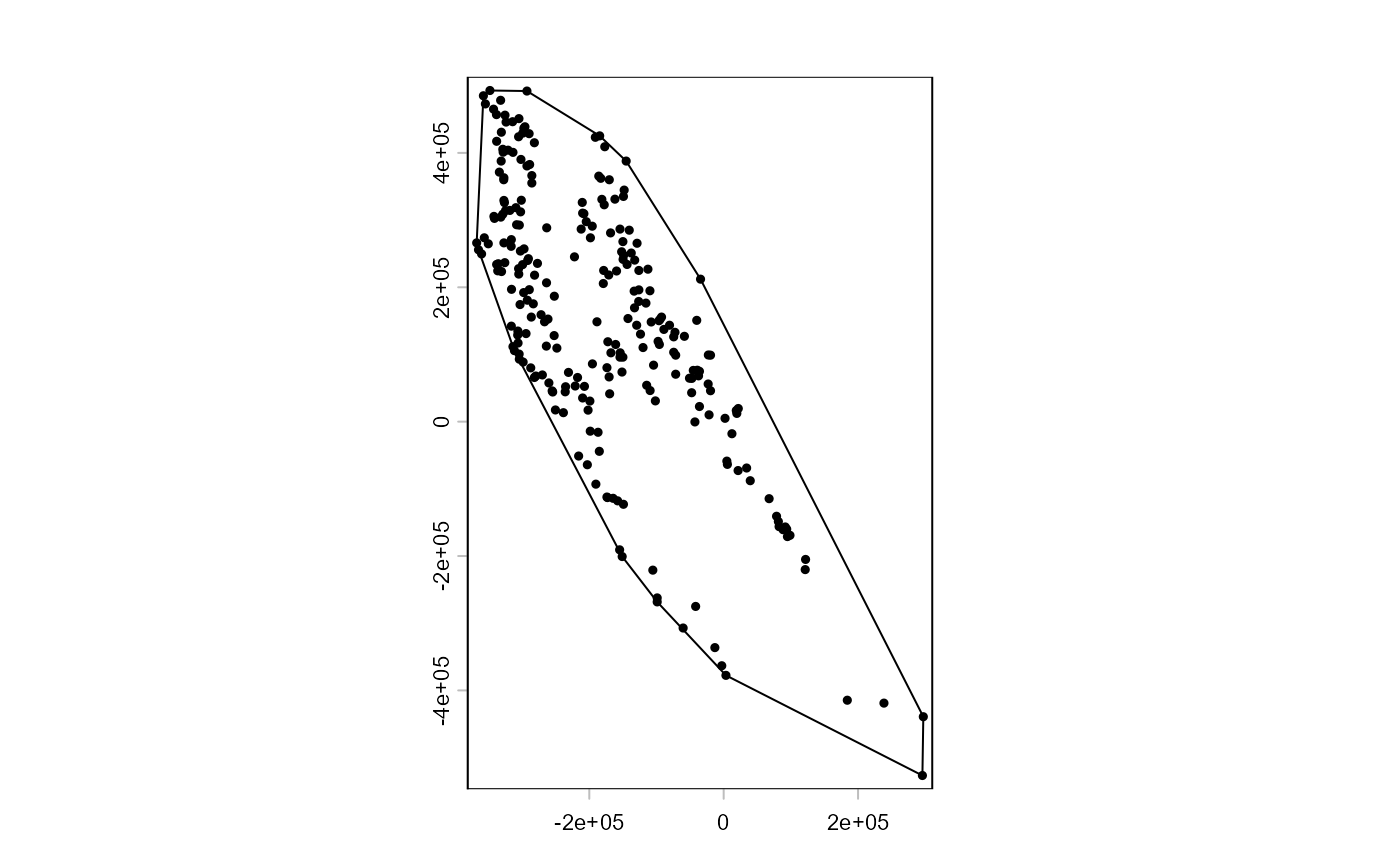
mcp: calibration area is defined by a minimum convex polygon. Usage method = 'mcp'.
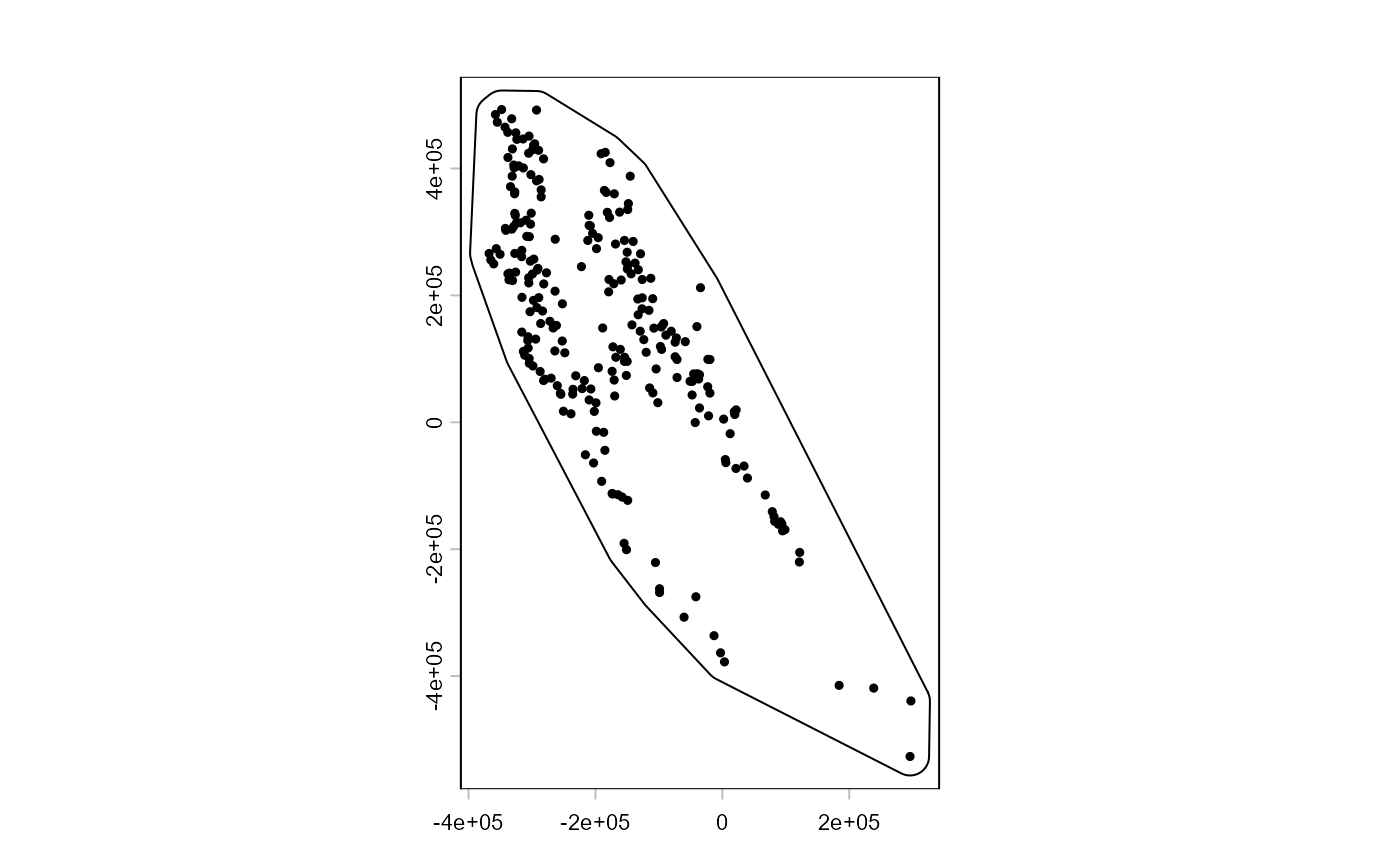
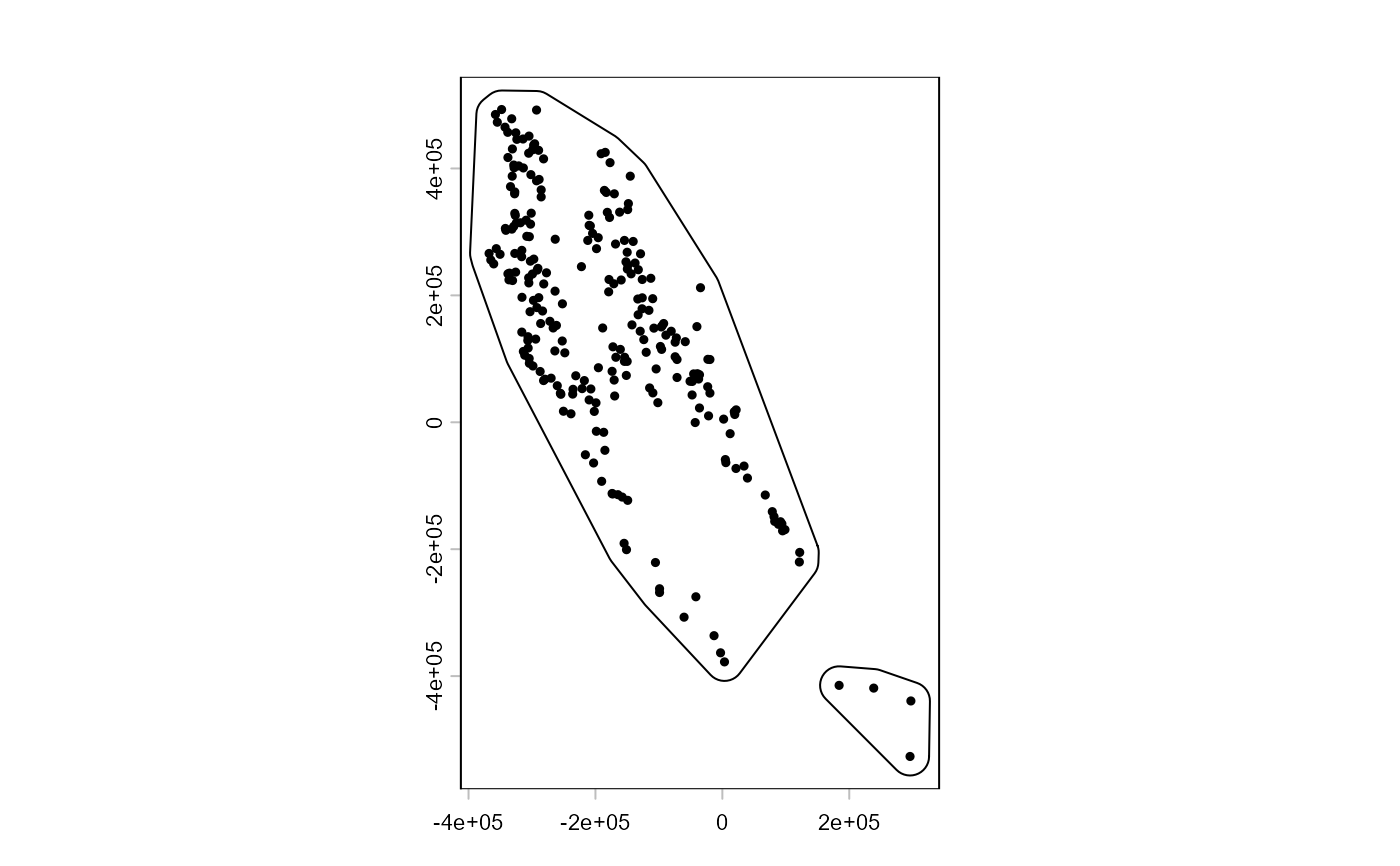
bmcp: calibration area is defined by buffered minimum convex polygon with buffer width. Usage method = c('bmcp', width=40000). A value of the buffer width in m must be provided if CRS has a longitude/latitude, or in map units in other cases
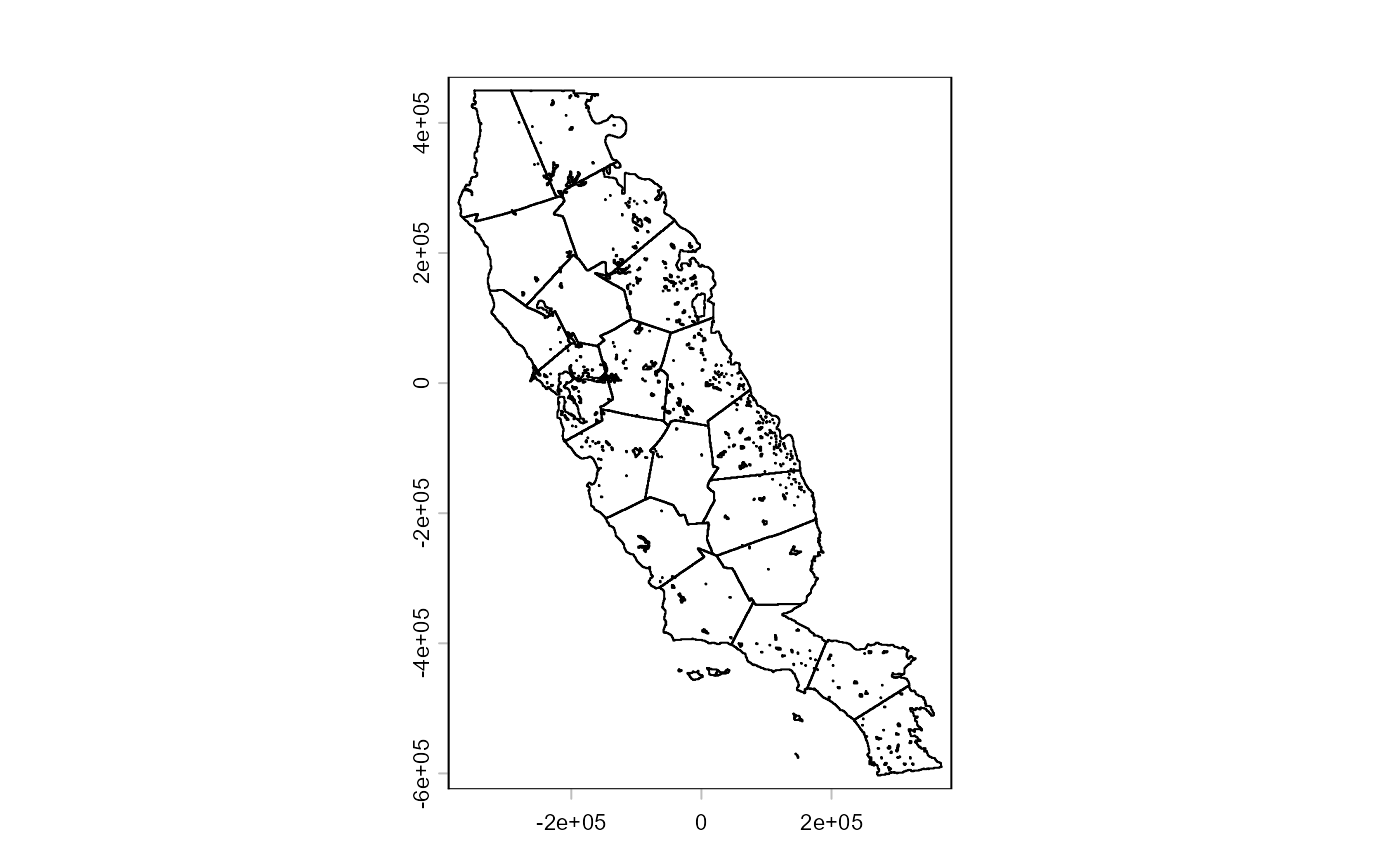
mask: calibration area is defined by selected polygons in a spatial vector object intersected by presences. Usage method = c("mask", clusters, "DN"). The second concatenated element must be a SpatVector, the third element is a character with the column name from SpatVector used for filtering polygons.
- groups
character. Column name indicating differentiated subsets of points. This could be used with mcp and bmcp method. Default NULL
- crs
character. Coordinate reference system used for transforming occurrences and outputs. If set as NULL, the result of mask method will have the same crs as the SpatVector used. Define a crs is mandatory for buffer, mcp and bmcp method.
Examples
data("spp")
sp1 <- spp[spp$species == "sp1" & spp$pr_ab == 1, ]
clusters <- terra::vect(system.file("external/clusters.shp", package = "flexsdm"))
# Calibration area: buffer of 40 km around the records
ca_toy <- calib_area(
data = sp1,
x = "x",
y = "y",
method = c("buffer", width = 40000),
crs = terra::crs(clusters)
)
ca_toy
#> class : SpatVector
#> geometry : polygons
#> dimensions : 1, 0 (geometries, attributes)
#> extent : -407610.8, 337129.2, -566648.3, 532871.7 (xmin, xmax, ymin, ymax)
#> coord. ref. : NAD83 / California Albers (EPSG:3310)
# \donttest{
require(terra)
#> Loading required package: terra
#> terra 1.9.50
#>
#> Attaching package: ‘terra’
#> The following objects are masked from ‘package:testthat’:
#>
#> compare, describe
require(dplyr)
data("spp")
clusters <- system.file("external/clusters.shp", package = "flexsdm")
clusters <- terra::vect(clusters)
single_spp <-
spp %>%
dplyr::filter(species == "sp1") %>%
dplyr::filter(pr_ab == 1) %>%
dplyr::select(-pr_ab)
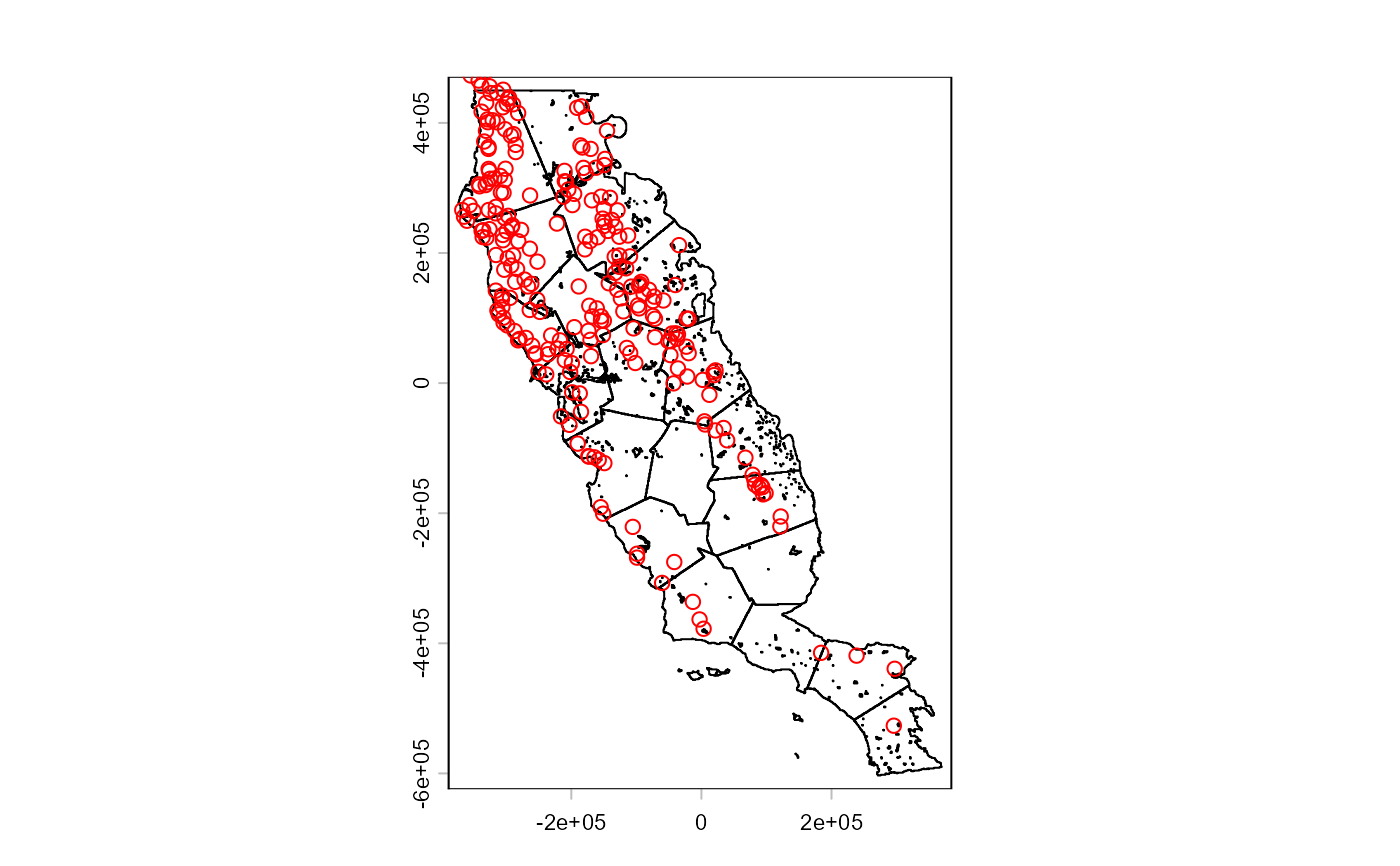
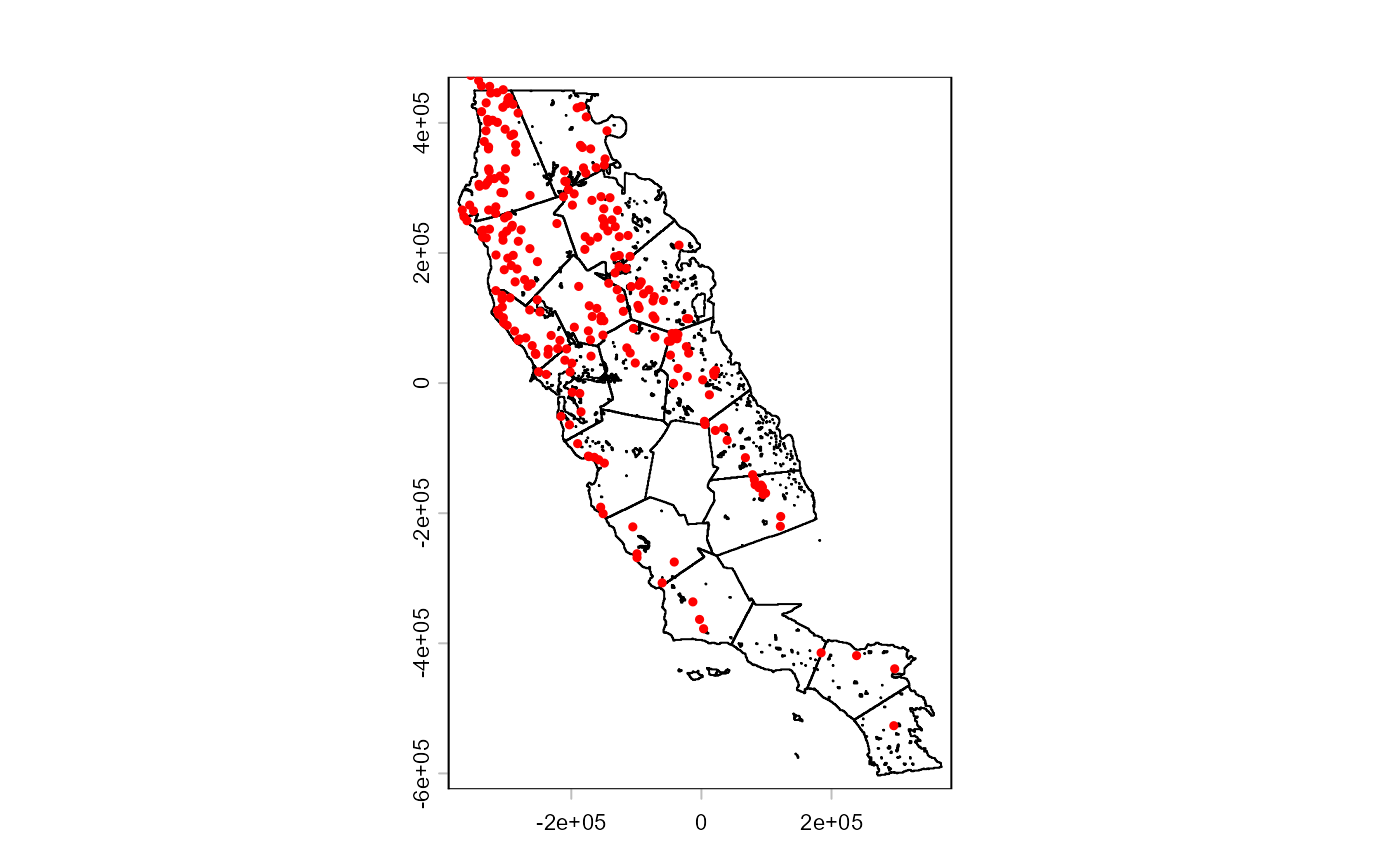
plot(clusters)
points(single_spp[-1], col = "red")
 crs(clusters, proj = TRUE) # coordinate reference system (CRS) used for this points database
#> [1] "+proj=aea +lat_0=0 +lon_0=-120 +lat_1=34 +lat_2=40.5 +x_0=0 +y_0=-4000000 +datum=NAD83 +units=m +no_defs"
# note that the unit of this CRS is in m, consequently the buffer width
# will be interpreted in m too
# buffer method
ca_1 <- calib_area(
data = single_spp,
x = "x",
y = "y",
method = c("buffer", width = 40000),
crs = crs(clusters)
)
plot(ca_1)
points(single_spp[, 2:3], pch = 19, cex = 0.5)
crs(clusters, proj = TRUE) # coordinate reference system (CRS) used for this points database
#> [1] "+proj=aea +lat_0=0 +lon_0=-120 +lat_1=34 +lat_2=40.5 +x_0=0 +y_0=-4000000 +datum=NAD83 +units=m +no_defs"
# note that the unit of this CRS is in m, consequently the buffer width
# will be interpreted in m too
# buffer method
ca_1 <- calib_area(
data = single_spp,
x = "x",
y = "y",
method = c("buffer", width = 40000),
crs = crs(clusters)
)
plot(ca_1)
points(single_spp[, 2:3], pch = 19, cex = 0.5)
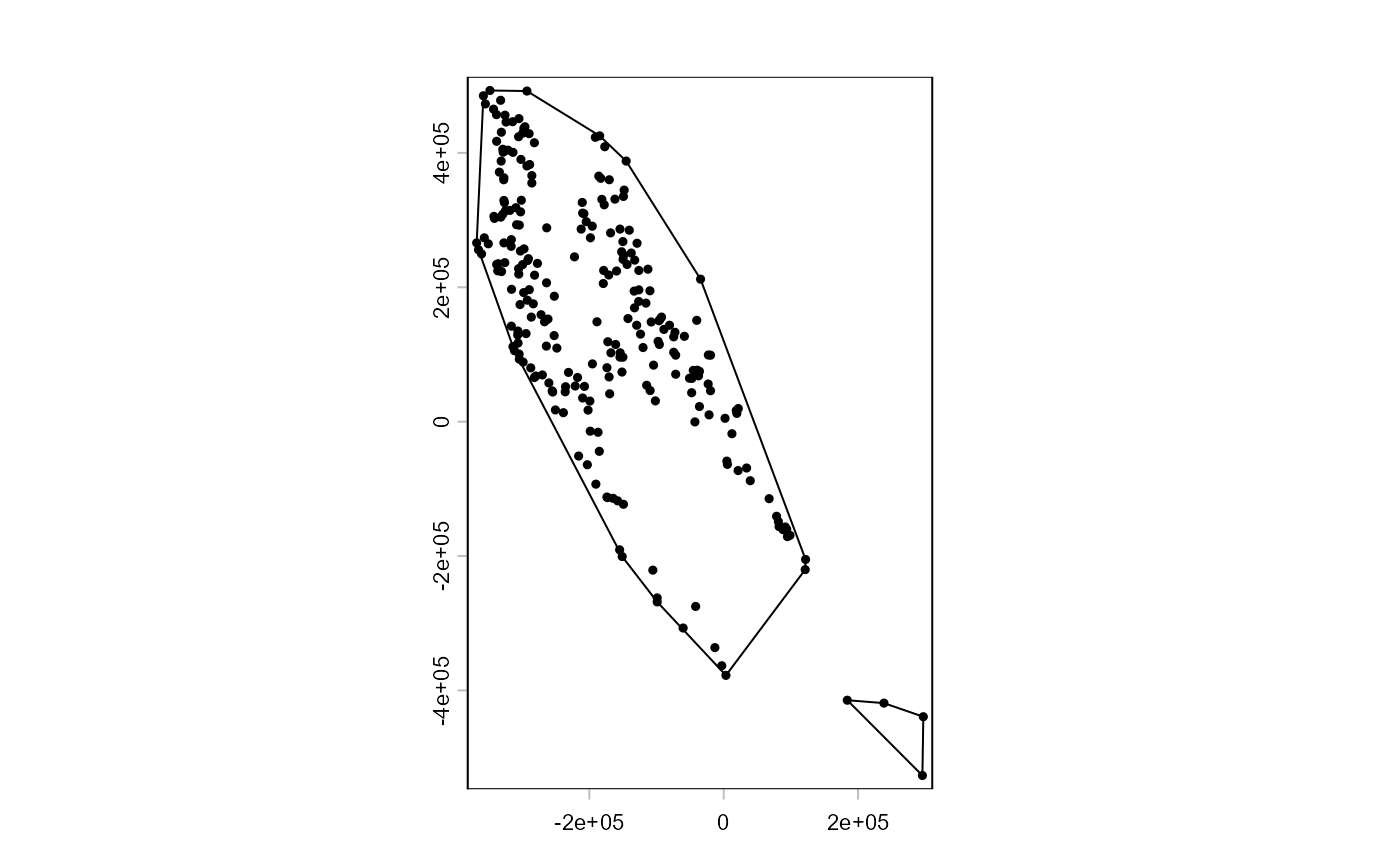
 # mcp method
ca_2 <- calib_area(
data = single_spp,
x = "x",
y = "y",
method = "mcp",
crs = crs(clusters)
)
plot(ca_2)
points(single_spp[, 2:3], pch = 19, cex = 0.5)
# mcp method
ca_2 <- calib_area(
data = single_spp,
x = "x",
y = "y",
method = "mcp",
crs = crs(clusters)
)
plot(ca_2)
points(single_spp[, 2:3], pch = 19, cex = 0.5)
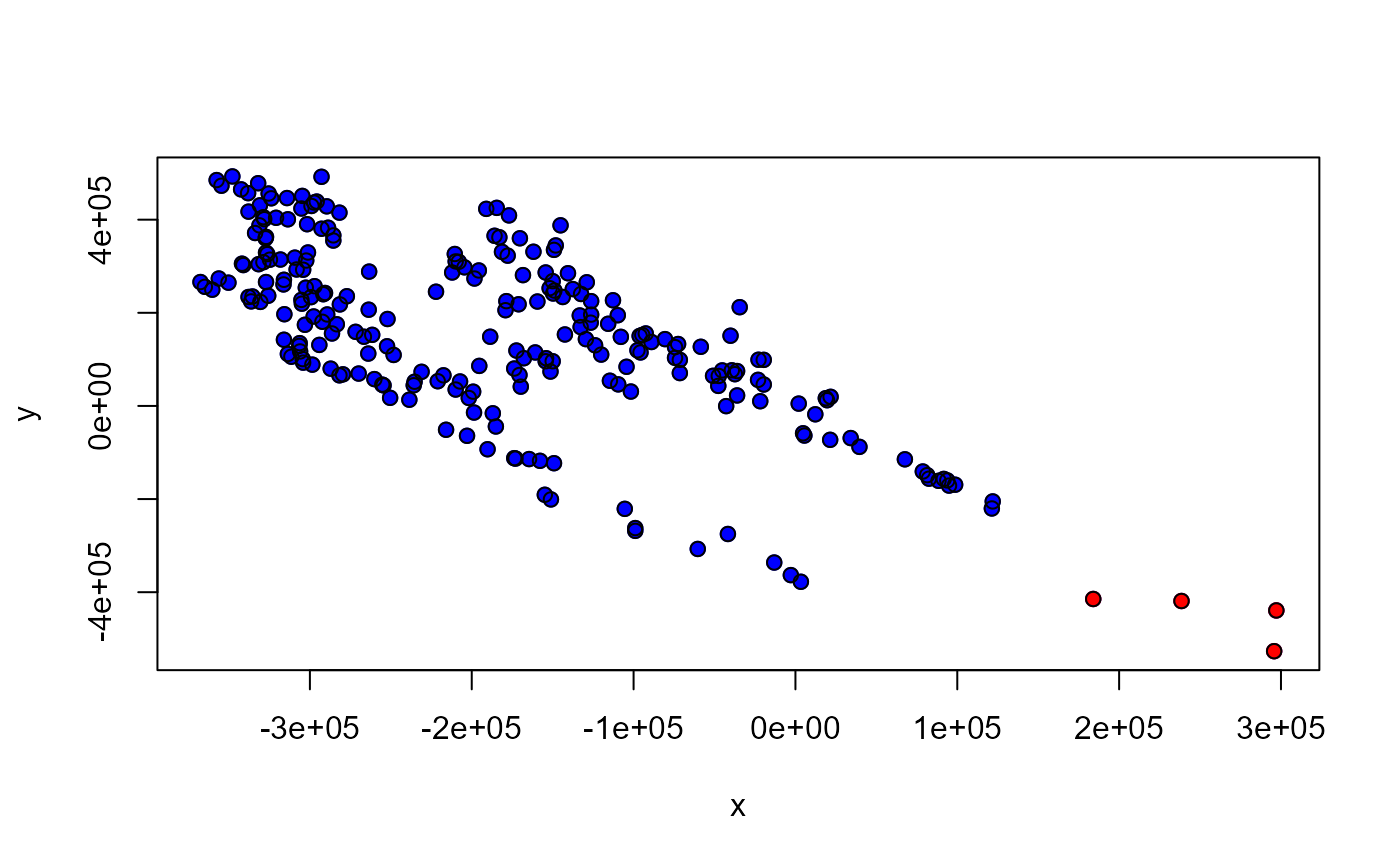
 # mcp method for different groups
single_spp <- single_spp %>% mutate(groups = ifelse(x > 150000, "a", "b"))
plot(single_spp[, 2:3], pch = 19, col = "blue")
points(single_spp[single_spp$groups == "a", 2:3], col = "red", pch = 19)
points(single_spp[, 2:3])
# mcp method for different groups
single_spp <- single_spp %>% mutate(groups = ifelse(x > 150000, "a", "b"))
plot(single_spp[, 2:3], pch = 19, col = "blue")
points(single_spp[single_spp$groups == "a", 2:3], col = "red", pch = 19)
points(single_spp[, 2:3])
 ca_2.1 <- calib_area(
data = single_spp,
x = "x",
y = "y",
method = c("mcp"),
crs = crs(clusters),
groups = "groups"
)
plot(ca_2.1)
points(single_spp[, 2:3], pch = 19, cex = 0.5)
ca_2.1 <- calib_area(
data = single_spp,
x = "x",
y = "y",
method = c("mcp"),
crs = crs(clusters),
groups = "groups"
)
plot(ca_2.1)
points(single_spp[, 2:3], pch = 19, cex = 0.5)
 # bmcp method
ca_3 <- calib_area(
data = single_spp,
x = "x",
y = "y",
method = c("bmcp", width = 30000),
crs = crs(clusters)
)
plot(ca_3)
points(single_spp[, 2:3], pch = 19, cex = 0.5)
# bmcp method
ca_3 <- calib_area(
data = single_spp,
x = "x",
y = "y",
method = c("bmcp", width = 30000),
crs = crs(clusters)
)
plot(ca_3)
points(single_spp[, 2:3], pch = 19, cex = 0.5)
 # bmcp method for different groups
ca_3.1 <- calib_area(
data = single_spp,
x = "x",
y = "y",
method = c("bmcp", width = 30000),
crs = crs(clusters),
groups = "groups"
)
plot(ca_3.1)
points(single_spp[, 2:3], pch = 19, cex = 0.5)
# bmcp method for different groups
ca_3.1 <- calib_area(
data = single_spp,
x = "x",
y = "y",
method = c("bmcp", width = 30000),
crs = crs(clusters),
groups = "groups"
)
plot(ca_3.1)
points(single_spp[, 2:3], pch = 19, cex = 0.5)
 # mask method
plot(clusters)
# mask method
plot(clusters)
 names(clusters)
#> [1] "clusters"
ca_3.1 <- calib_area(
data = single_spp,
x = "x",
y = "y",
method = c("mask", clusters, "clusters"),
)
plot(ca_3.1)
points(single_spp[, 2:3], pch = 19, cex = 0.5, col = "red")
names(clusters)
#> [1] "clusters"
ca_3.1 <- calib_area(
data = single_spp,
x = "x",
y = "y",
method = c("mask", clusters, "clusters"),
)
plot(ca_3.1)
points(single_spp[, 2:3], pch = 19, cex = 0.5, col = "red")
 # }
# }